Big picture insight into the most current trends and market statistics.
Request a Demo
Big picture insight into the most current trends and market statistics.
Request a DemoView and download
Visualize quarterly market indicators quickly and download in Excel as pure data along with tables and graphs..
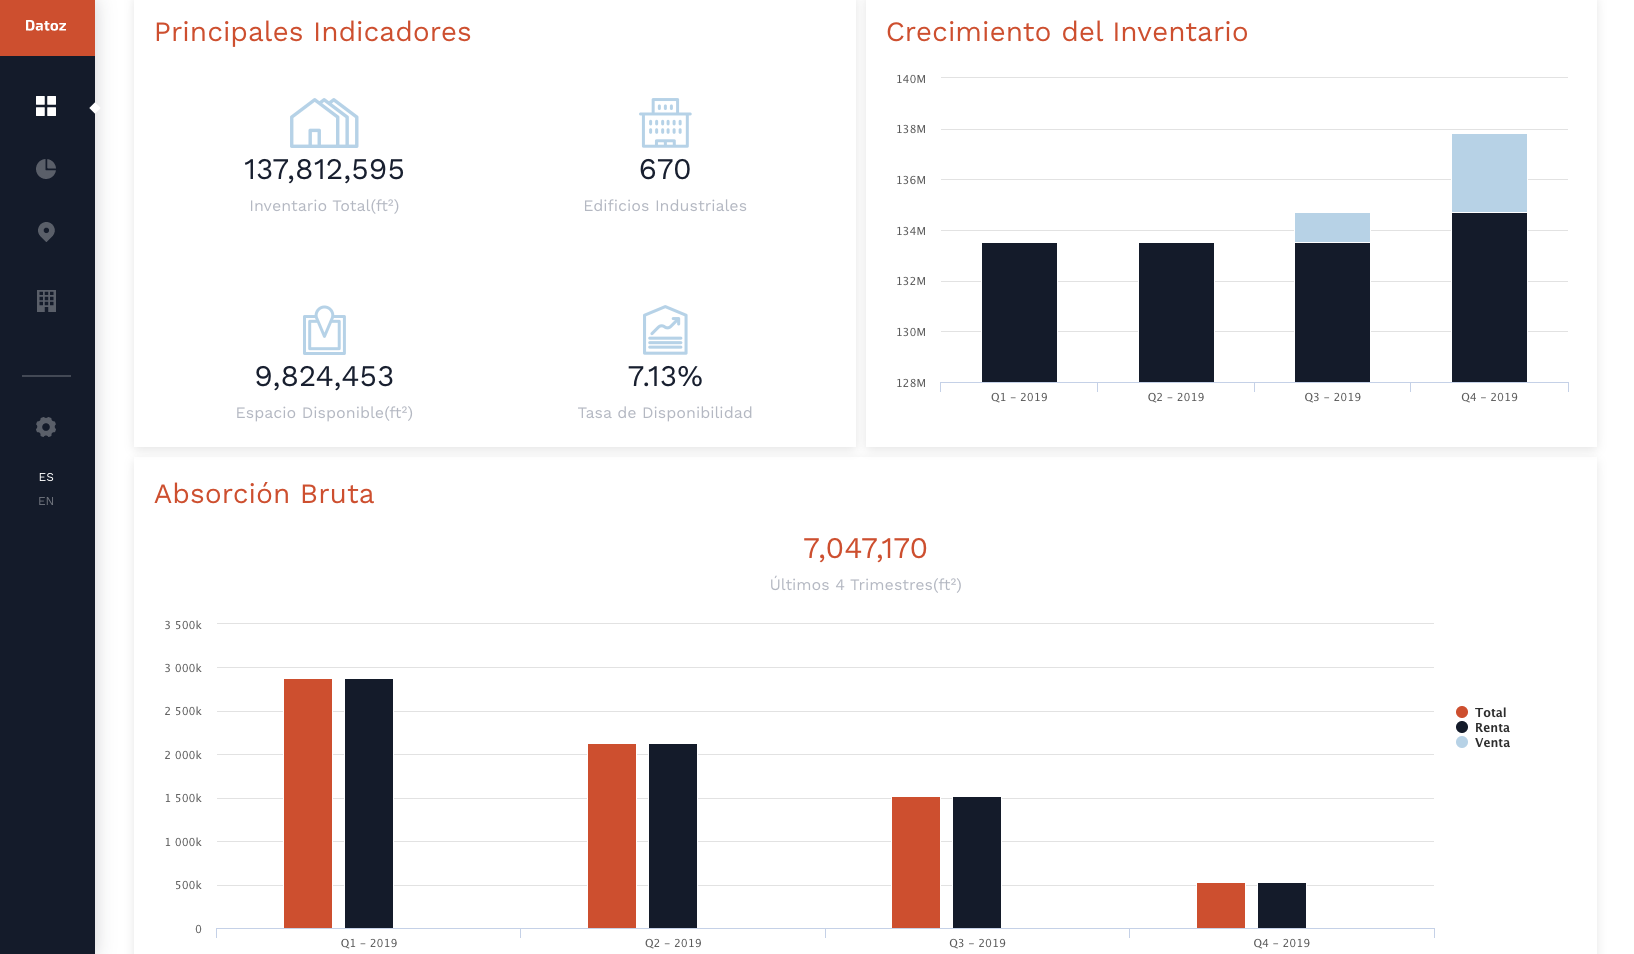

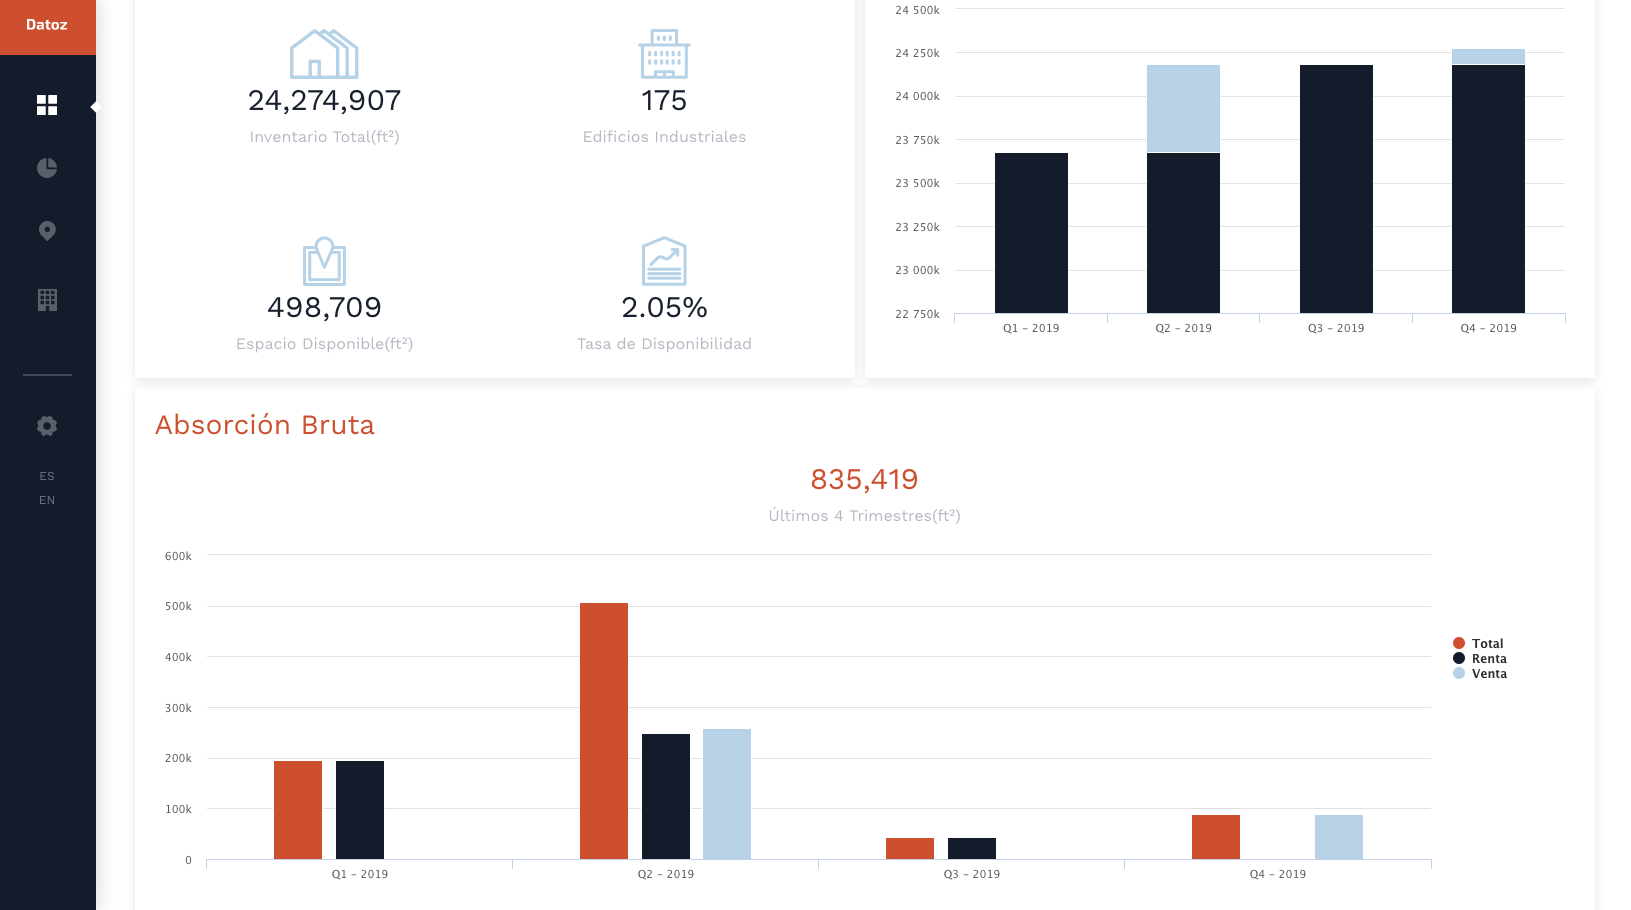
Absorption
Analyze the gross absorption of each market, broken down by type of operation and periods.
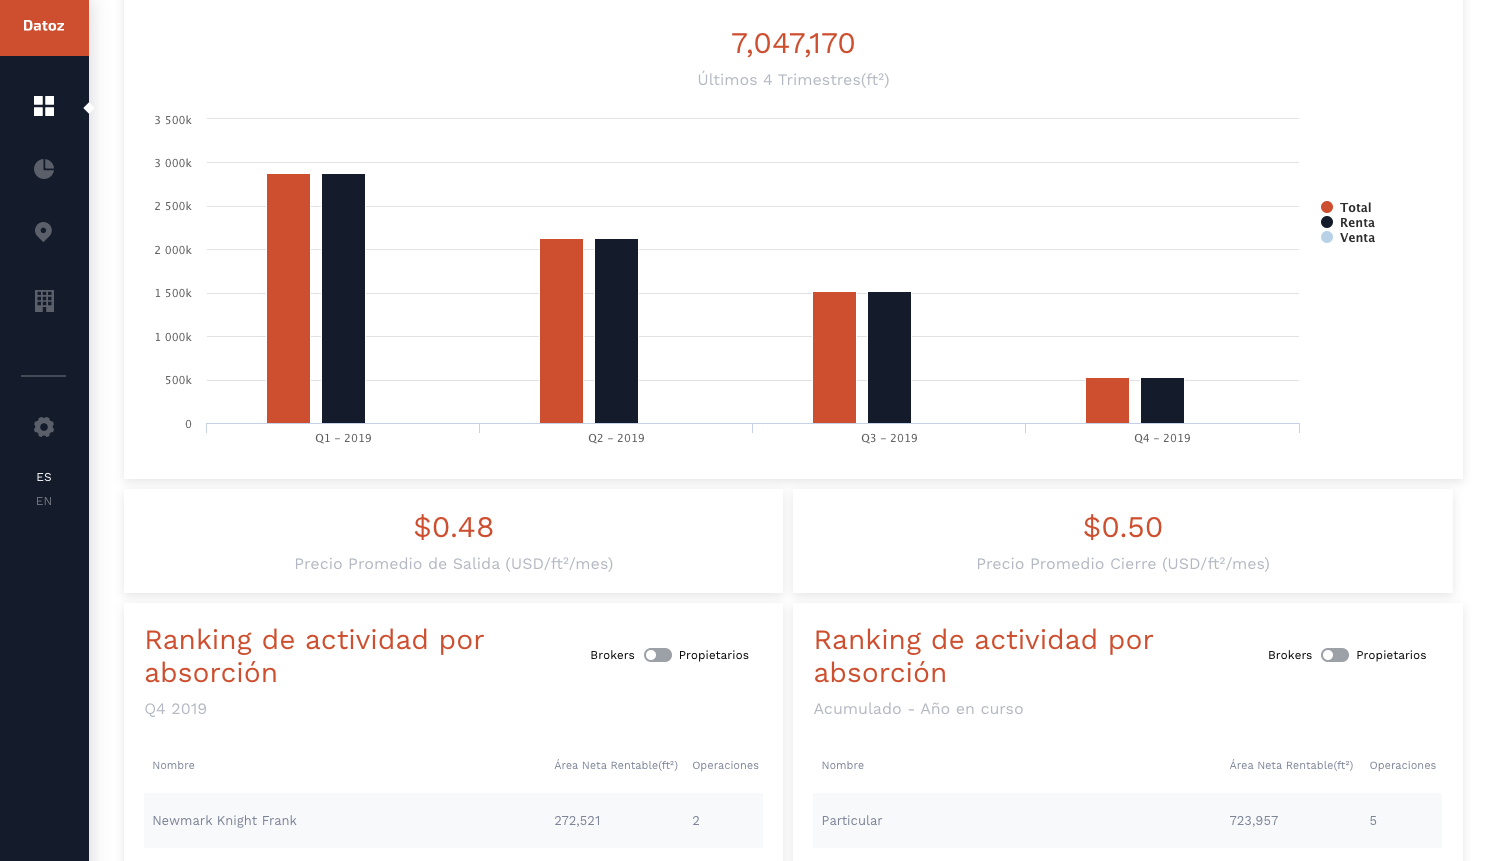

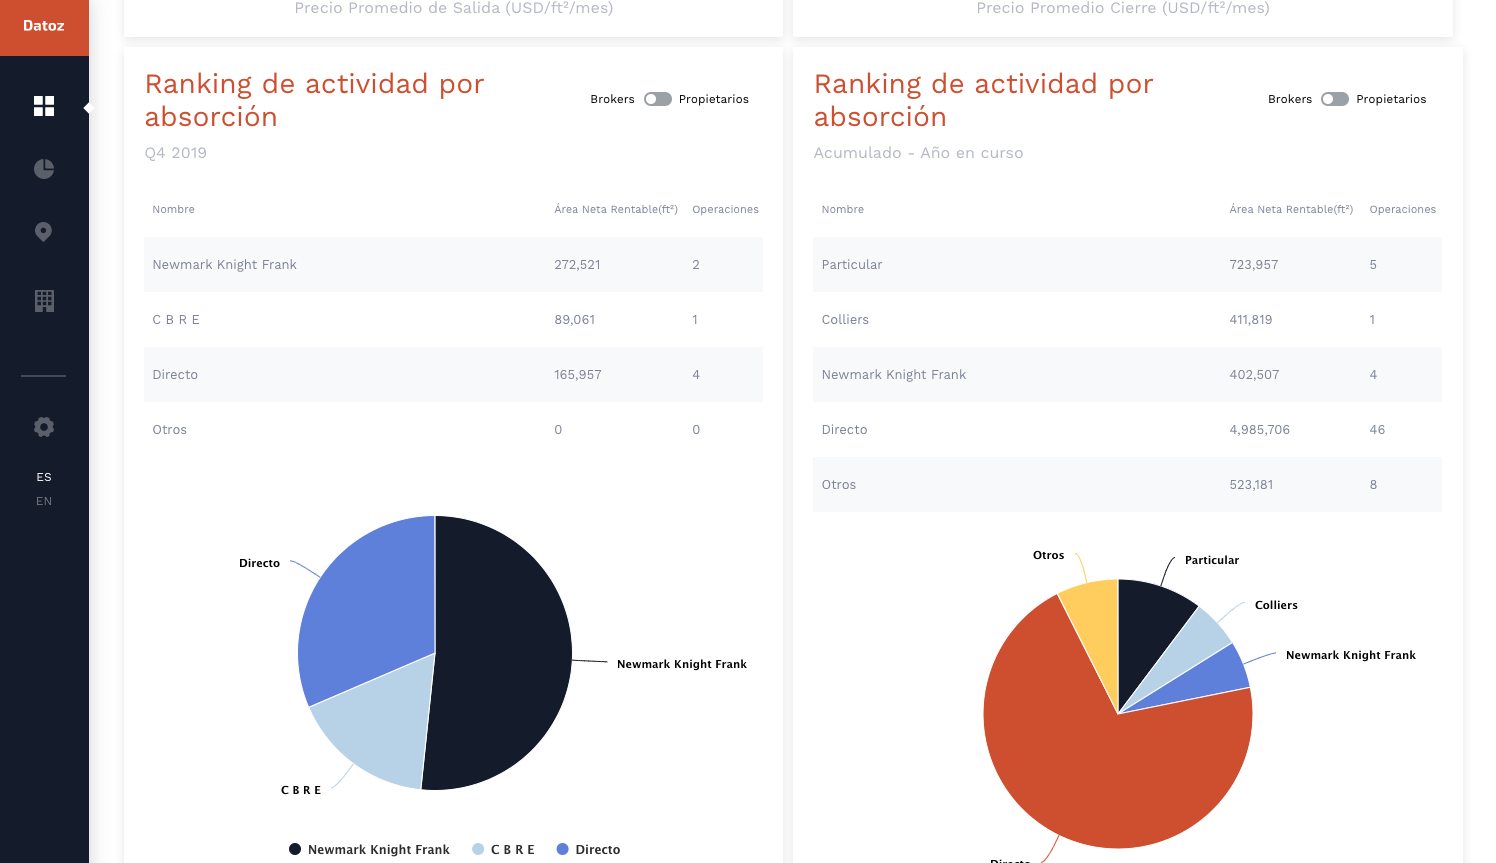
Rankings
Quarterly and year-to-date rankings of the brokerage firms and development companies’ absorption activity.