To facilitate access to industrial real estate market information, Datoz offers a “Delimitaciones Personalizadas” feature within its API. This tool allows users to draw a polygon over any industrial area of interest.
Through this functionality, users can obtain key indicators such as inventory, absorption, vacancy rate, availability, and asking price, among others, on an annual, quarterly, or monthly basis.
This capability is particularly useful for analyzing industrial areas that extend beyond predefined market or submarket boundaries, such as areas that span more than two submarkets.
CTT Has the Lowest Vacancy Rate in the Market
To illustrate the scope of this tool, the image shows a polygon outlining the CTT Corridor, which includes the Cuautitlán, Tultitlán, and Tepotzotlán submarkets. The objective is to compare its vacancy rate with that of Mexico City’s industrial market as of the end of 2Q 2026.
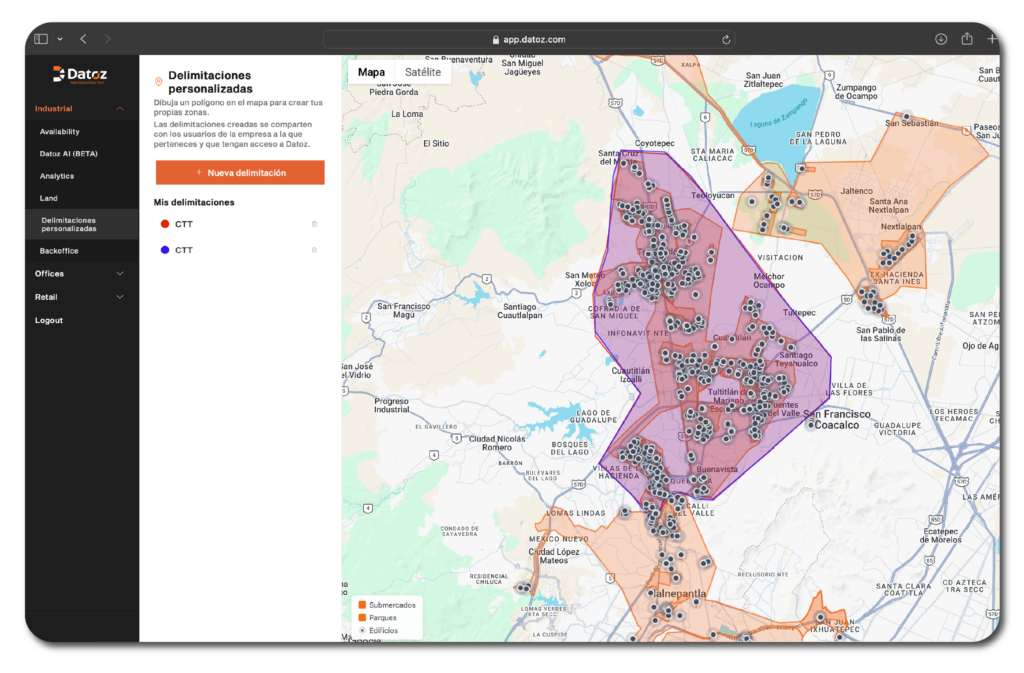
The CTT Corridor alone accounts for half of the vacant space in Mexico City. Because the CTT Corridor represents nearly 60% of Mexico City’s industrial inventory, it also accounts for a significant share of vacant space. While the CTT Corridor has 352,000 m² of vacant space, Mexico City has 664,000 m².
Cuautitlán is the largest submarket within the corridor, with an inventory of 5.6 million m² and 203,000 m² of vacant space, equivalent to a vacancy rate of 3.64%. Tepotzotlán, with a smaller inventory of 2 million m², has the highest vacancy rate in the corridor at 3.94%, while Tultitlán, with an inventory of 2.6 million m², has the lowest rate at just 2.66%.
By segmenting information by market, submarket, or “Delimitaciones Personalizadas,” users can precisely identify vacancy levels across an area as extensive as Mexico City, providing a strategic advantage when identifying real estate opportunities.
If you are looking for a customized analysis, request a demo and learn more about the Delimitaciones Personalizadas feature.